
Home » Alle berichten » Productivity » Gantt vs timeline: understanding the difference and choosing the right planning method
ChatGPT said:
Gantt vs timeline: understanding the difference and choosing the right planning method
Clear planning is essential for any coordinated project, and two of the most widely used tools are Gantt charts and timelines. Although they may look similar at first glance, they serve different purposes and offer different levels of detail. Understanding Gantt vs timeline helps you choose the right structure for your project, improve team communication, and avoid planning traps that slow down execution. This guide breaks down the differences, when to use each, and how to implement both effectively.
In short:
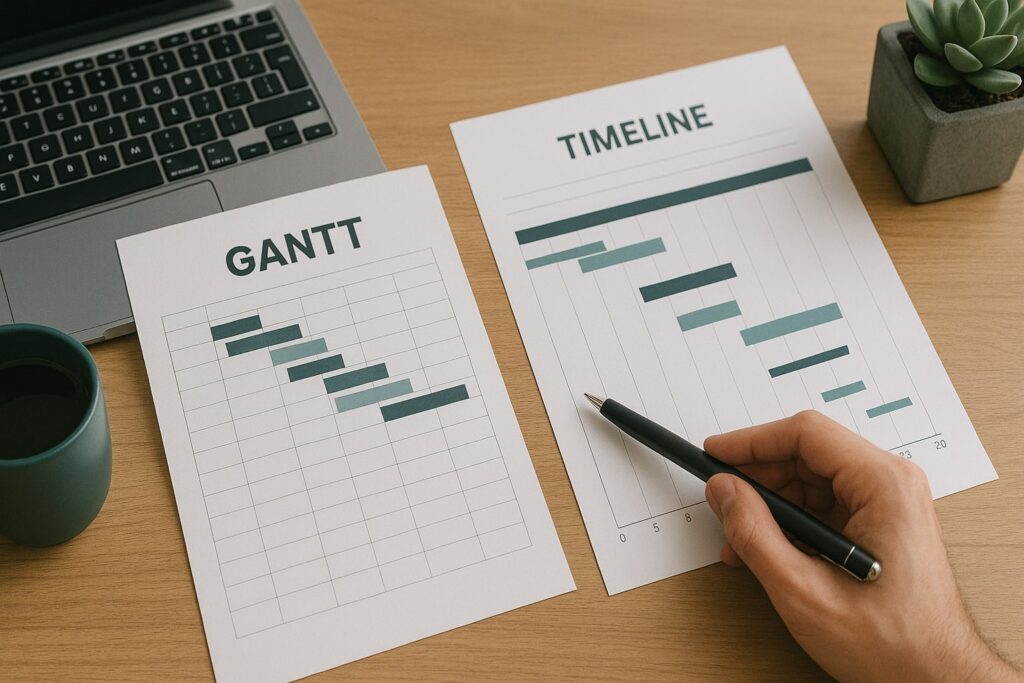
Gantt charts visualize tasks, durations, dependencies, and workload, making them ideal for complex projects.
Timelines show major phases and milestones without intense detail, keeping communication simple.
Choosing between gantt vs timeline depends on complexity, stakeholders, and the level of control you need.
Both tools benefit from templates, structured updates, and clear ownership.
TheGrowthIndex.com recommends using timelines for alignment and Gantt charts for execution.
Why understanding gantt vs timeline matters for better planning
When teams struggle with coordination, it’s rarely because of a lack of effort—it’s because the planning tool doesn’t match the complexity of the project. Gantt charts and timelines solve different problems, and choosing the wrong one can create unnecessary confusion. A timeline keeps everyone aligned and focused on the big picture, while a Gantt chart dives into the granular steps that help you track progress more precisely. Knowing which tool fits your situation prevents wasted energy and keeps your planning scalable.
What a Gantt chart does that a timeline cannot
A Gantt chart is designed for detailed project execution. It includes:
Task breakdowns: small, actionable items that roll up into larger phases.
Dependencies: showing which tasks must happen before others.
Durations: start and end dates for each task.
Parallel work: identifying overlapping responsibilities.
Workload visibility: who is doing what and when.
This is ideal when your project contains tightly connected tasks that rely on sequence and timing.
Also interesting

What a timeline does better than a Gantt chart
A timeline is intentionally simple. It helps you:
Communicate the overall flow of a project
Highlight key milestones
Present at a high level to stakeholders
Avoid overwhelming early-stage planning
Create alignment before diving into execution
Instead of task-level detail, a timeline shows major phases such as “Discovery,” “Build,” “Launch,” without zooming in on every step.
When to use gantt vs timeline for maximum clarity
A practical way to choose:
Use a Gantt chart when:
Task dependencies matter
The project contains multiple teams
You need precise tracking
Delays in one area affect the entire plan
Use a timeline when:
You’re presenting to leadership
You’re still defining scope
Only the sequence of phases matters
You want simplicity in communication
Many teams start with a timeline and transition to a Gantt chart when they move into full execution.
Step-by-step guide: building a Gantt chart that teams actually use
A Gantt chart is only effective when it’s clear and not overloaded. Follow this process:
Step 1: Break the project into major phases
Examples: Planning, Design, Development, Testing, Launch.
Step 2: List all tasks within each phase
Use clear, actionable task names and keep each task small enough to estimate properly.
Step 3: Establish dependencies
Identify tasks that must start after others finish. This helps you predict risks earlier.
Step 4: Add start and end dates
Avoid unrealistic timelines. Use past data when possible.
Step 5: Assign task owners
Every task should have one primary owner, even if multiple people contribute.
Step 6: Review workload and adjust
Make sure no individual is overloaded at the same time.
Step 7: Update weekly
A Gantt chart becomes useless if it’s outdated. Short, consistent updates keep it accurate.
Step-by-step guide: creating a timeline for high-level project communication
Timelines excel when you need simplicity and clarity. Here’s how to build one:
Step 1: Define the major phases
Think in large blocks rather than detailed tasks.
Step 2: Place phases on a linear axis
Highlight the sequence, not the day-by-day execution.
Step 3: Add key milestones
Launch dates, approval points, or major deliverables.
Step 4: Keep visuals clean
Avoid overcrowding—timelines lose value when too detailed.
Step 5: Update during major changes
Unlike a Gantt chart, timelines don’t need weekly updates unless the project direction shifts.
"Start with a timeline for alignment—switch to a Gantt chart when execution requires precision."
Using gantt vs timeline to manage stakeholder expectations
Executives and clients often need clarity, not details. A timeline is perfect for presentations:
It communicates the story of the project
It shows how phases connect
It highlights critical dates
Meanwhile, internal teams benefit more from a Gantt chart, where responsibilities and deadlines are explicitly defined. TheGrowthIndex.com often recommends sharing both views depending on the audience.
Mistakes teams make when choosing gantt vs timeline
Avoid these common pitfalls:
Mistake 1: Choosing a Gantt chart too early
When scoping isn’t clear, filling out a detailed Gantt chart becomes guesswork.
Mistake 2: Using only one tool
Large projects need both a high-level picture and execution detail.
Mistake 3: Overloading a timeline with too much detail
If everything is important, nothing is.
Mistake 4: Ignoring dependencies in a Gantt chart
This leads to unrealistic schedules and missed deadlines.
Mistake 5: Failing to maintain the chart
Tools quickly lose value when they don’t reflect reality.
Integrating gantt vs timeline views in project management tools
Most modern tools allow you to switch between multiple views. Platforms like Asana, Monday.com, Notion, and Wrike offer:
List view
Kanban view
Gantt view
Timeline view
Calendar view
This flexibility means you can present the same data in different formats without duplicating work. Use a timeline view for alignment and a Gantt view for detailed execution.
How gantt vs timeline impacts risk management
A timeline highlights when major phases might collide but doesn’t show the roots of potential delays.
A Gantt chart reveals risks because you can immediately see:
Bottlenecks
Overlapping deadlines
Overloaded team members
Tasks with tight dependencies
This makes the Gantt chart far better for predicting problems before they happen.
Also interesting


Gantt vs timeline for agile vs traditional project management
Traditional (waterfall) projects
Gantt charts shine because tasks follow a linear sequence.
Agile teams
Timelines often fit better during roadmap planning, while Gantt charts help with cross-team coordination when needed.
Teams practicing hybrid approaches use both tools fluidly depending on the phase.
Adding templates to make planning faster and more consistent
Templates help teams avoid reinventing project structures. Include:
Phase templates
Milestone templates
Standard task sets
Dependency frameworks
Role-specific checklists
Consistent templates create predictable patterns that improve accuracy and reduce setup time. TheGrowthIndex.com often sees that teams with well-structured templates execute faster because they reduce ambiguity.
Choosing the right tool for gantt vs timeline in your workflow
Before committing to a tool, ask yourself:
Does my project have strict dependencies?
How many teams are involved?
How detailed do I need planning to be?
Will stakeholders need a simplified view?
How often will the plan be updated?
If the project is complex, choose a tool with a strong Gantt view.
If it’s communication-heavy, choose one with a clean timeline view.
Bringing clarity to your projects with the right planning approach
Ultimately, gantt vs timeline isn’t an either/or decision. Both tools serve different levels of clarity and both strengthen project visibility when used correctly. Gantt charts keep internal teams aligned on the specifics, while timelines make it easier to communicate the project story to stakeholders. When these tools work together, projects become more predictable, risks decrease, and everyone understands the path forward.

Lina Mercer
Lina Mercer is a technology writer and strategic advisor with a passion for helping founders and professionals understand the forces shaping modern growth. She blends experience from the SaaS industry with a strong editorial background, making complex innovations accessible without losing depth. On TheGrowthIndex.com, Lina covers topics such as business intelligence, AI adoption, digital transformation, and the habits that enable sustainable long-term growth.